Daily Solar Graph
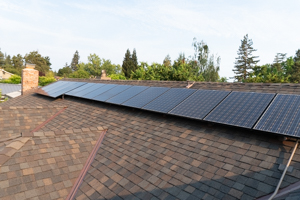
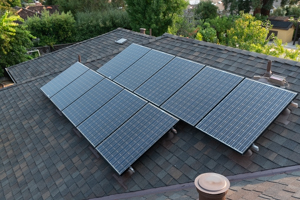
This application displays historical data from our photovoltaic
arrays. From 2006 to mid-2020, our home had twenty-four 200-watt solar panels,
half facing south
and half facing west. In mid-2020, the panels were rearranged and four additional
panels were installed. Data is available from 22 December 2006
onward, although there is no data for 27 December 2007 through 18 March
2009 and for a few other dates.
Annual summaries are available here.
More information is available on my blog:
Photovoltaic System Updates
Original system:
Photovoltaic Part 1
Photovoltaic, Part 2: Specifications and Installation
Photovoltaic, Part 3: Results
Comments? You can contact me at solar@bluepopcorn.net